Course Authors
Gary M. Levin, M.D.
Dr. Levin is Clinical Assistant Professor, Department of Ophthalmology, Loma Linda University, Loma Linda, California.
Within the past three years, Dr. Levin reports no commercial conflict of interest.
Estimated course time: 1 hour(s).

Albert Einstein College of Medicine – Montefiore Medical Center designates this enduring material activity for a maximum of 1.0 AMA PRA Category 1 Credit(s)™. Physicians should claim only the credit commensurate with the extent of their participation in the activity.
In support of improving patient care, this activity has been planned and implemented by Albert Einstein College of Medicine-Montefiore Medical Center and InterMDnet. Albert Einstein College of Medicine – Montefiore Medical Center is jointly accredited by the Accreditation Council for Continuing Medical Education (ACCME), the Accreditation Council for Pharmacy Education (ACPE), and the American Nurses Credentialing Center (ANCC), to provide continuing education for the healthcare team.
Upon completion of this Cyberounds®, you should be able to:
Describe the anatomic features of glaucoma
Describe the pathophysiology of glaucoma
Define the new paradigm for diagnosing glaucoma.
Most physicians are familiar with the concept of open versus narrow or closed angle glaucoma. However, this dichotomy has become a vast oversimplification as our knowledge and experience have increased in the last two decades.(1) As a consequence, a screening evaluation test for glaucoma no longer merely consists of merely an intraocular pressure check.(2)
Intraocular pressure is the result of the careful balance between aqueous production by the ciliary processes and the outflow channels in the angle recess of the anterior chamber, as well as the uveoscleral outflow path.
Figure 1. The Anatomy of the Anterior Chamber.
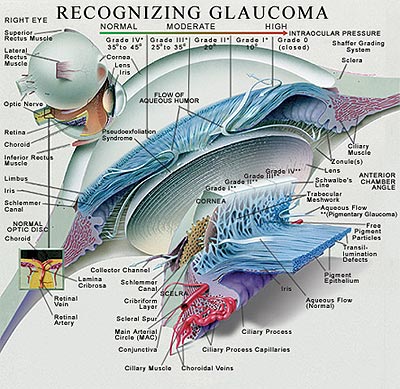
The artist's cross-sectional rendition of the anterior chamber and iris diaphragm carefully defines the angle structures, grading system of angle closure and the iris-lens-ciliary body relationship of the eye. The rendition also illustrates the fine microstructure of the outflow channels from the eye.
The images were provided as a courtesy by images.md and are reproduced herein with permission for educational purposes only.
In typical open angle glaucoma,(3) the outflow channels and the uveoscleral outflow path become occluded with aging or other disease processes. Though ocular pressure is independent of systemic blood pressure regulation mechanisms, the associated presence of hypertension can potentiate the harmful effects of elevated intraocular pressure.
Any imbalance between aqueous production and aqueous outflow will result in a gradual or sudden rise in intraocular pressure. The relative sudden pupillary block caused by an angle closure will elevate the IOP quickly, while the chronic pathology present in open angle, pseudoexfoliative,(4) inflammatory or phacogenic glaucoma occurs more slowly.
Ocular hypertension has been defined as the presence of intraocular pressure greater than 21 mm of mercury without visible changes in the optic nerve and/or visual field test (see below). However, long-term studies of patients with ocular hypertension clearly show these patients are at higher risk of developing glaucomatous visual field losses over time. Ophthalmologists have become much more sensitive to earlier treatment in this group if other risk factors such as ethnicity, diabetes and/or hypertension, as well as family history, are present.
Normal tension glaucoma, a diagnostic category (also called low tension glaucoma), is reserved for patients with intraocular pressures in the range of 10 to 20 mm of mercury who display increasing optic nerve atrophy and glaucomatous visual field loss.(5) Treatment for these patients still relies upon lowering the intraocular pressure using standard non-invasive and/or surgical intervention.(6),(7)
There are also about 50 other subcategories of glaucoma that exist, ranging from the juvenile forms of glaucoma to pseudoexfoliation syndromes, traumatic glaucoma, inflammatory glaucoma, as well as some rare inherited syndromes. Glaucoma is frequently a complication of neovascular changes from any ischemic insult to the eye such as central vein occlusions, diabetic retinopathy, and/or multiple surgical interventions. Tumors, metastatic to the eye or primary of the eye, can induce glaucoma as well.
Drug Induced Glaucoma
It is well known and documented in the PDR that antihistamines, H2 antagonists, may worsen chronic open angle glaucoma. Severe acute angle closure glaucoma and acute myopia have been reported with topimarate. The use of oral, injectable and inhaled corticosteroids causes an elevation of intraocular pressure in about 15% of the normal population.
Visual Field Testing: Quickie Course
We know that intraocular pressure (IOP) is subject to a diurnal change, one that becomes exaggerated in patients with glaucoma. A one-time IOP measurement is meaningless without a history, examination and a careful threshold visual field test, or FDT (frequency doubling technology) test. The sum of these tests will lead the ophthalmologist to a more definitive examination and routine follow-up examinations.
Figure 2. Clinical Standardized Perimeters.
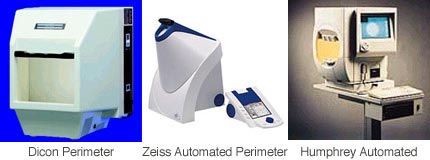
SWAP (Short Wavelength Automated Perimetry) or "blue-on-yellow" perimetry (Humphrey):(8),(9) SWAP presents blue static stimuli on a uniform yellow background and is intended to test a smaller population of retinal neurons that selectively respond to those color wavelengths. The test is thought to potentially reveal visual field loss 5-6 years ahead of traditional white-on-white automated perimetry but it requires a significantly longer testing time.
FASTPAC, SITA (Swedish Interactive Testing Algorithm) Standard, SITA Fast (Humphrey): These tests use "intelligent" analysis of the patient's responses and age-normed statistical data to significantly shorten the testing time. There may be some limitations in terms of analysis of field loss progression, as well as limitations on the number of missed point re-tests, but statistical correlation with traditional threshold testing is good.
Kinetic Fixation Perimetry (Dicon): A feature unique to these perimeters is that the patient is constantly looking at a moving fixation target during testing, which has been found to make the visual field testing more comfortable for the patient.
Multiple Stimulus Presentation (Dicon): One to four stimuli are presented at a time, requiring the patient to respond one to four times, respectively. Meant to speed the visual field testing, it is not used regularly for most patients.
Frequency Doubling Technology Perimeters(12),(13)
What are 'M' Cells and 'P' Cells and Why Care?
Retinal nerve fibers can be classified into two main types that transmit signals from the retinal receptor cells by way of the optic nerve to the lateral geniculate body and ultimately to the visual cortex. These are the Magno-cellular (or M) cells, and the Parvo-cellular (or P) cells.
The M-cell pathway is responsible for low-contrast, high temporal frequency (or motion) stimulus detection. For example, a black car rapidly passing by a driver's side window at night may stimulate the driver's M-cell neurons. The P-cell pathway is responsible for high-contrast, low temporal frequency (or static) stimulus detection. An example would be a patient attempting to read the smallest letters possible on a standard projected Snellen eye chart. The larger diameter M cell neurons constitute approximately 10% of the total number of retinal nerve fibers. It has been found that a particular M-cell neuron subset comprising a third to a half of the M-cell neurons (called "non-linear" M-cells) are usually the first to die in glaucoma, and this unique pathological characteristic established the basis for frequency doubling testing.
When a low spatial frequency sinusoidal grating with alternating wide light and dark bars undergoes high temporal-frequency counter-phase flicker (i.e., the black bands reverse to become white and the white bands reverse to become become black in rapid sequence), the grating appears to have twice as many light/dark bars (i.e., its spatial frequency appears doubled), as shown in the example below (Figure 3). This phenomenon is called the frequency doubling illusion:
Figure 3. Frequency Doubling Illusion.
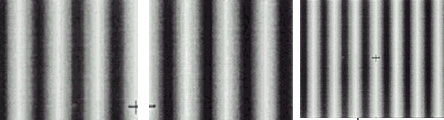
High frequency (e.g., 20-30 Hz) alternation between light and dark bars (e.g., 1 cycle per degree) shown on the left two images creates the doubling illusion (2 cycles per degree grating) shown on the right image. (One cycle = light + dark bar.)
Diagnosing Glaucoma
We know that certain populations are at higher risk of visual field loss from optic nerve damage. Hispanics, African Americans, patients with diabetes and patients who also have systemic hypertension(14) all are at greater risk of glaucomatous visual field loss. Many ophthalmologists also suspect that there are additional unknown metabolic factors, either genetically determined or involved with signaling molecules, which induce cellular apoptosis and subsequent nerve fiber loss.(15)
Ophthalmologists now define glaucomatous visual field loss as a loss of peripheral vision with very early enlargement of the blind spot (or a nasal step field loss). Nasal step field loss is defined as loss that does not cross the horizontal midline in the nasal visual field. While we are born with approximately one million optic nerve fibers, the classic early visual field loss, as measured with standard threshold Humphrey computerized perimeters, occurs only after half of these fibers are lost.
Several newer standard tests, now available, theoretically test for loss of intermediary retinal nerve fibers as the earliest sign of glaucoma. The blue visual field test and the frequency doubling test, which involve different stimuli that have lower thresholds for diagnosing visual field losses, are current diagnostic options.
Figure 4. Recognizing Glaucoma.
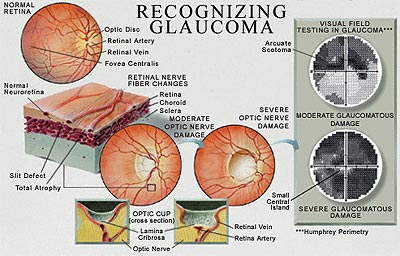
Artist's rendition of optic nerve damage subsequent to elevated intraocular pressure, and resultant visual field defect (gray scale rendition) with perimetric testing.
To make the diagnosis of glaucoma, it is necessary to measure intraocular pressure. Schiotz tonometry is considered obsolete, except perhaps in the emergency room setting when a red eye is examined by a primary care physician to rule out angle closure glaucoma. Developments in laser refractive surgery have led us to understand better the inherent inaccuracy associated with measuring intraocular pressures using current tonometer devices.(16) According to recent studies, the Goldman applanation tonometer is more accurate when corrected for corneal thickness. A nomogram has now been developed to correct for this shift.(17)
The IOP inaccuracy was first noted by surgeons measuring corneal thickness using ultrasound pachymetry(18),(19) before and after lasik (laser assisted in situ keratomileusis) surgery for the correction of refractive errors. Postoperatively, it was found that intraocular pressures were lowered by several millimeters of mercury. Pachymetry (measurement of corneal thickness) is performed using ultrasound in a simple contact procedure with topical anesthetic. Studies have also revealed differences in corneal thickness in different ethnic groups.(20)
Figure 5. Measuring Corneal Thickness.
Ultrasound probe with topical anesthetic to measure corneal thickness. Normal value: 550 microns; range: 400-650 microns.
It is now standard practice to measure corneal thickness in all glaucoma suspect patients. The measurement takes about 30 seconds or less.(21) The examination of the glaucoma suspect also includes gonioscopy. Gonioscopy is performed at the slit lamp with a contact mirrored contact lens that allows direct visualization of the angle recess to determine the state of the anterior chamber's depth and the anatomy of the chamber angle where the trabecular meshwork overlies Schlem's canal and the aqueous exits the eye into the aqueous vein drainage system. Dilated fundus examination allows quantifying the cupping of the optic nerve and a bilateral comparison of left and right optic nerves. Cup disk ratios greater than 0.5 are suspicious, and a disparity of more than 0.1 between eyes is also suspicious. Optic nerve measurements can also be documented with stereo photography for later comparison. This has been an important consideration because progression of changes is almost imperceptible.(22)
Ocular coherence tomography is a scanning system that can measure the shape, volume and also nerve fiber layer thickness of the optic nerve fiber rim and the macula.(23) This is an extremely sensitive and accurate diagnostic tool in patients with questionable visual field loss and/or borderline intraocular pressure. Some Asian populations also have thinner corneas.(24) The use of these tools together has shifted the threshold at which most ophthalmologists begin therapeutics. We also now recognize there are many "normal variants" of optic nerve appearance. Normal variants and the anatomy of the optic nerve are shown below (Figures 6A, 6B. 6C, 6D). Abnormal optic nerves are also shown (Figure 7).
Figure 6. Normal Variants of Optic Nerve Appearance.(25)
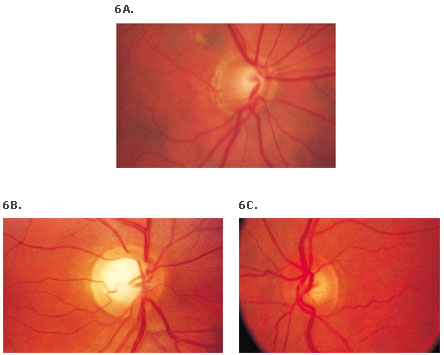
6D. Anatomy of the optic nerve.
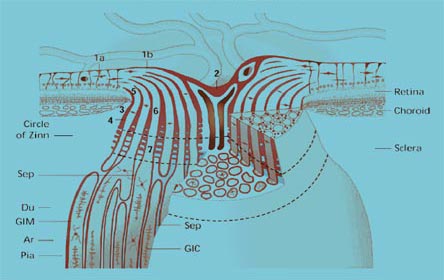
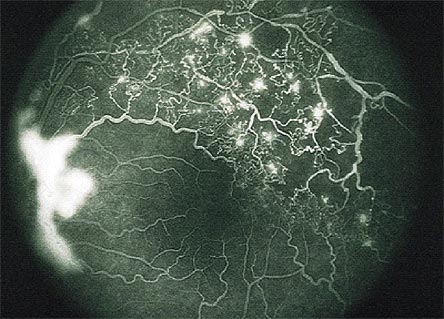
Figure 7. Funduscopic View of the Left Eye of Patient with Central Retina Vein Occlusion.
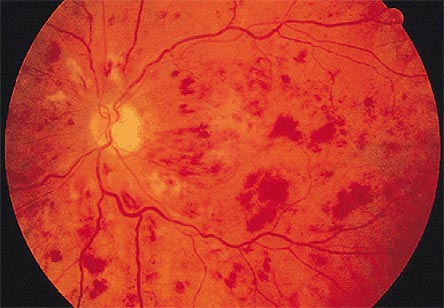
Clinical and angiographic appearance of central retinal vein occlusion associated with dilated retinal veins, retinal hemorrhages, and macular edema.
The retinal vein occlusion shown in Figure 7 can lead to secondary neovascular glaucoma. A fluorescein angiogram reveals blockage and ischemic changes in the posterior segment leading to elaboration of Vascular endothelial growth factor leading to neovascularization of the retina, and neovascularization of the iris as well, as shown in Figure 8A and 8B.
Figure 8A and 8B. Appearance of Iris with High Power Slit Lamp.
Figure 8A. Rubeosis iridis.
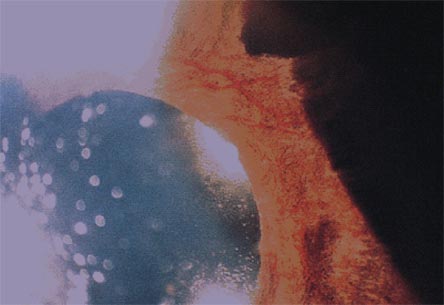
Figure 8B. Branch vein occlusion associated with neovascularization of the disc.
Biomicroscope reveals the presence of new vessels in the iris stroma, keratitic precipitates on corneal endothelium, aqueous flare and a fixed pupil (8A). These new vessels spread over the trabecular meshwork and cause angle closure and iris root contraction (8B). These abnormal vessels are without tight junctions so protein leaks into the aqueous humor raising the protein count.
Signs and Symptoms of Angle Closure Glaucoma
Most physicians are familiar with the triad of symptoms and signs of angle closure glaucoma that result in a sudden rise in IOP from closure of the anterior chamber. The symptoms -- frontal headache, halos around lights, nausea -- do not, however, always precede the attack. Hyperopia (a short or small eye) often is a predisposing finding because the anterior segment is smaller, or crowded. The "penlight" across the anterior chamber test can visualize the shadow cast nasally by the anterior convexity of the iris in a shallow anterior chamber. A red eye with pain and a mid-sized fixed pupil are very suspicious of this event. Intraocular pressures will often exceed 50 mm of mercury and this is a true medical emergency to be treated medically with either laser iridotomy or surgical iridotomy. [Development of a cataract and the increasing size of the crystalline lens as we age can also cause angle closure problems in a more chronic manner.]
Figure 9. Ultrasound Imaging of Anterior Segment of Patient with Phacogenic Glaucoma.
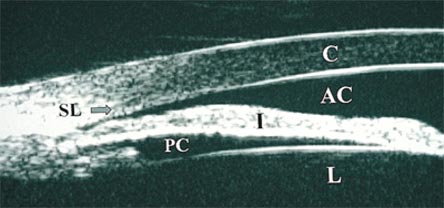
Large cataractous lens with appositional angle closure to the level of Schwalbe's line.
Postscript: Pediatric Glaucoma
Newborn and infantile glaucoma can present at or shortly after birth.These children may have enlarged cloudy corneas from elevated intraocular pressure at birth. Because the scleral elasticity is greater in infants, the cornea and sclera expand, since the weakest portion of the globe is not at the optic nerve head. The abnormality is in the microstructure of the trabecular meshwork. The illustrations below depict enlarged cornea, aniridia, Axenfeld's syndrome (characterized by an anterior displacement of Schwalbe's line visible at 3 o'clock) in Figure 12 below. Older infants may present with epiphora (watery eyes) and eye rubbing. Often the parents will note "what beautiful big eyes my baby has". Because these conditions are very rare, the average general ophthalmologist only sees one or two of these in their career. The differential diagnosis of cloudy corneas in children is summarized in Table 1 below.
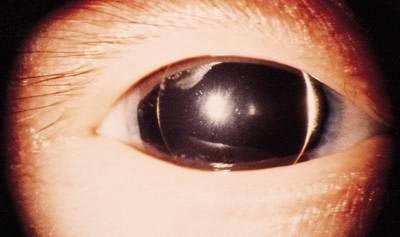
Figure 10. Enlarged Cornea.
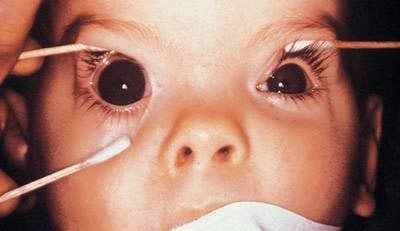
Note unilateral enlarged cornea O.D.; the right cornea measures 13 mm and the left cornea measures 10 mm.
Figure 11. Aniridia.
The patient has a total lack of iris.
Figure 12. Reiger-Axenfeld Anomaly.
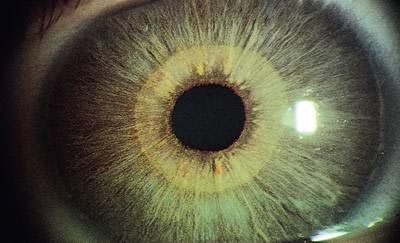
Table 1. Differential Diagnosis of Cloudy Corneas (Glassy-eyed Children).
| Diagnosis | Laterality | Systemic Disease? | Corneal Diameter |
| Primary infantile glaucoma | Unilateral or bilateral | No | Large |
| Sclerocornea | Unilateral or bilateral (90%) | No | Appears small, but is normal |
| Megalocornea | Bilateral | No | Large |
| CHED or CHSD | Bilateral | No | Normal |
| Metabolic disorders (e.g. mucopolysaccharidoses, mucolipidoses, Lowe's syndrome | Bilateral | Yes | Normal |
| Birth trauma | Unilateral | No | Normal |
| Corneal dermoid | Unilateral | No | Normal |
| Peter's anomaly | Unilateral or bilateral | No | Normal |
| Congenital rubella | Unilateral or bilateral | Yes | Small |
Summary
- Early diagnosis of glaucoma is an important component of successful treatment.
- The index of suspicion for glaucoma is much higher now. The threshold for diagnosis and treatment has been lowered and is based upon intraocular pressures, diurnal pressure changes, optic nerve appearance, advanced threshold perimetry and focused on earlier detection of visual field loss. Progression of visual field loss is critical.
- Corneal thickness must be measured to obtain an accurate and true intraocular pressure with the tonometer.
- The addition of ocular coherence tomography allows for measuring of retinal nerve fiber thickness very accurately.
- Normal or low tension glaucoma is an important set of patients who are diagnosed with glaucoma. These patients may have IOPs from 10 to 18 mm of mercury.
- The classification of glaucoma has become more complex, although the overall anatomic classification of open angle and narrow angle glaucoma remains the same.